BY BRUCE ANDERSON & DAVID COLETTO
Abacus Data Inc.
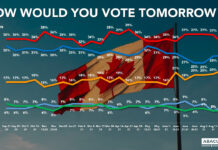
 LAST month we saw a four-point slip in Liberal Party support; in our latest survey the Liberals have stabilized and would win 40% support today. The Conservatives are at 32%. Both these numbers are identical to the results last election day in 2015.
In the three seat richest provinces, the Liberals have a six-point lead in Ontario, a 26-point lead in Quebec, and are tied with the NDP in BC.
Healthy gains are evident for the NDP in BC, apparently at the expense of both the Liberals and Conservatives. Over the next month or two, we will closely monitor this shift to see if it is sustained, and if so, to what degree it has to do with positive feelings about NDP Leader Jagdeep Singh, less positive feelings about the Justin Trudeau government, or a spillover of positive NDP sentiment from the provincial level.
The Liberals lead among all age groups except for those 60 and over. Much of the Liberal lead nationally is thanks to its margin among those under 45. We have seen a boost in support for the NDP among those under 30, up 15 from last month.
About half (49%) say the country is headed in the right direction, the highest number in a year and up six points from October’s dip. 29% say Canada is off on “the wrong track”.
 Approval of the federal government has also recovered from the seven-point drop noted last month. Today, 47% approve of the job the Trudeau government is doing, while 34% disapprove. This is closer to what we have tracked since the beginning of 2017.
Approval of the government is the plurality view in every place but Alberta and Saskatchewan and among all age groups under 60. 40% of those who voted NDP in 2015 approve of the Trudeau government performance while 75% of Liberal voters approve compared with 11% who disapprove.
Impressions of Trudeau’s are stable with 48% saying they have a positive view of the Prime Minister; 31% have a negative impression.
For Conservative Party Leader Andrew Scheer, his positives rose four points, but his negatives rose seven points over the last month.
For Singh, his positives are up by five, and now has 23% positive, 19% negative opinion – marking the first time since March that the NDP has had a leader with higher positive than negative opinion.
 Regionally, Trudeau has the highest net positive ratings in all regions except for the Prairies. Almost half in BC and Ontario have positive views of the Prime Minister while a majority in Quebec and two-thirds in Atlantic Canada feel positively about Trudeau.
Scheer is strongest in the Prairies where he has a net positive impression of +13. His impression in Ontario is about even with 23% having a positive impression and 26% having a negative impression.
Singh is viewed positively in Ontario and British Columbia (+8) and is net neutral in other regions. In Quebec, more people view Singh positively than Scheer (21% vs. 16%).
Over the next two years, we will also track impressions among three key groups of voters: Millennials, women, and those living in urban centres.
Among all three groups, Trudeau has held an edge over the other party leaders since the beginning of 2016. It’s worth keeping in mind for much of that time, the Conservative Party had an interim leader and (former NDP leader) Tom Mulcair was voted out by party members at the convention in Edmonton in early 2016.
As with impressions of Trudeau among all voters, there has been a softening of his image among these three groups. In January 2016, Trudeau had net positive scores of +47 among Millennials, +36 among women, and +33 among urban residents. Today, his numbers remain positive but the gap between those having a positive and negative impressions has shrunk in all three cases.
For the two new opposition leaders, Mr. Singh’s numbers are headed in a positive direction (after two months of our tracking) while Mr. Scheer’s are becoming more negative among Millennials and urban dwellers.
(The survey was conducted online with 1,500 Canadians aged 18 and over between November 10 and 14. A random sample of panelists was invited to complete the survey from a large representative panel of over 500,000 Canadians. The margin of error for a comparable probability-based random sample of 1,500 is +/- 2.5%, 19 times out of 20.)


